Introduction
It’s very common these days to want to have visibility into the technology assets or endpoints of a network, especially when there’s a concern with security and their respective monitoring. This happens because of the importance that a real-time view can provide for a company’s defensive security teams. The main problem is that we can’t always find low-cost tools to meet this need.
Fortunately, in the middle of 2014, Facebook released an open-source tool called Osquery that makes it possible to meet this need and can be used for monitoring security anomalies, checking compliance and security policies, performance analysis, or even in the response and analysis of a security incident.
Osquery is a tool that allows you to monitor the operating system and several of its attributes and configurations differently. Basically, it makes it possible to understand a particular operating system that is running and what is happening on a machine. All this occurs through SQL queries, similar to what is done when a database is queried. This behavior opens up a huge range of query possibilities that can return valuable information about the system’s state. For example, with it, you can monitor the integrity of files, socket connections, running processes, and much more.
In Osquery, the tables correspond to a certain set of data representing components and OS states with the respective attributes of the objects. Next, we see a query referring to the table “logged_in_users,” representing users ‘logged in’ to the operating system.

In the example shown above, you can see the result of a simple query that provides details of users ‘logged in’ to the operating system in question. And this is just the tip of the iceberg for what Osquery can do as a monitoring and anomaly detection tool. Now it may be easier to see the tool’s potential and what we can try to generate with the inputs from the results. These can be used minimally to improve the logs in a SIEM and build use cases. If it’s not quite clear yet, we will elaborate on these possibilities in the topics of monitoring and anomaly detection.
Visibility and Monitoring
As already mentioned at the beginning of this article, a common problem in organizations is the low visibility of their endpoints. As a consequence, some teams don’t know exactly which endpoints are in their environment, or even the physical configuration of each of them, what programs are running, or if the operating system updates are kept up to date. Osquery can provide a very clear view, ensuring the state of the endpoints as well as whether they are working properly.
The visibility capability is critical not only for monitoring but also for making decisions when something is off track. In addition, visibility will allow you to better understand the environment in order to answer questions such as:
- Windows OS endpoints have which KBs installed?
- Which user is currently logged on?
- Which processes are running?
- What is the hardware configuration of the endpoint?
While Osquery brings the necessary visibility into endpoints so that it can assist Information Security or IT teams and can provide a robust query mechanism to expose information, this is usually not enough for it to be used in proper monitoring. The fact is that Osquery doesn’t provide a server or even a GUI (an acronym for Graphical User Interface) for easy management. Here FleetDM, formerly Kolide, will help with visibility management and monitoring.
FleetDM facilitates the management of Osquery-enabled endpoints by enabling and providing in a centralized way:
- Full view of endpoints that have Osquery installed;
- Centralized query logs;
- Query scheduling;
- Query packs for continuous monitoring.
Below is a screenshot of FleetDM with its interface demonstrating interesting initial details regarding the endpoints:
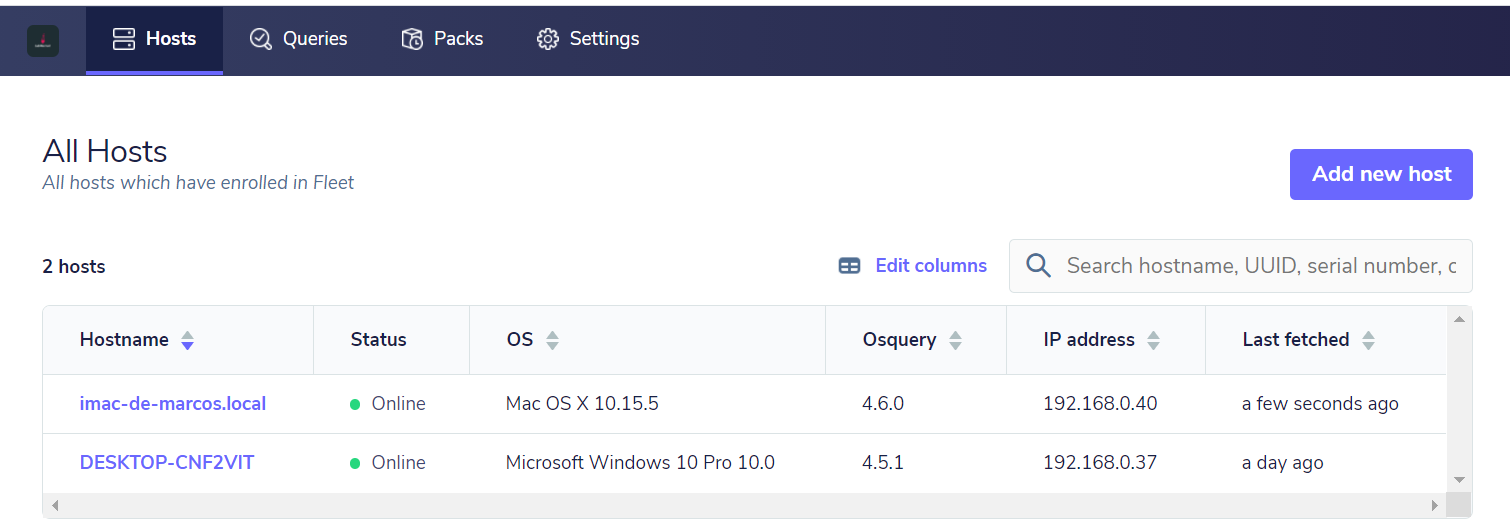
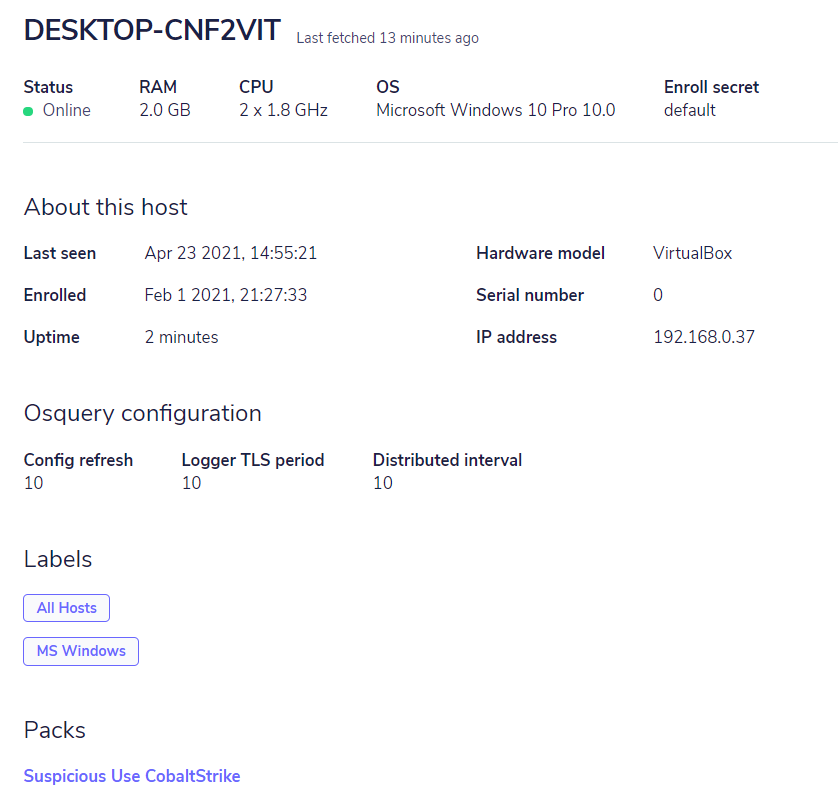
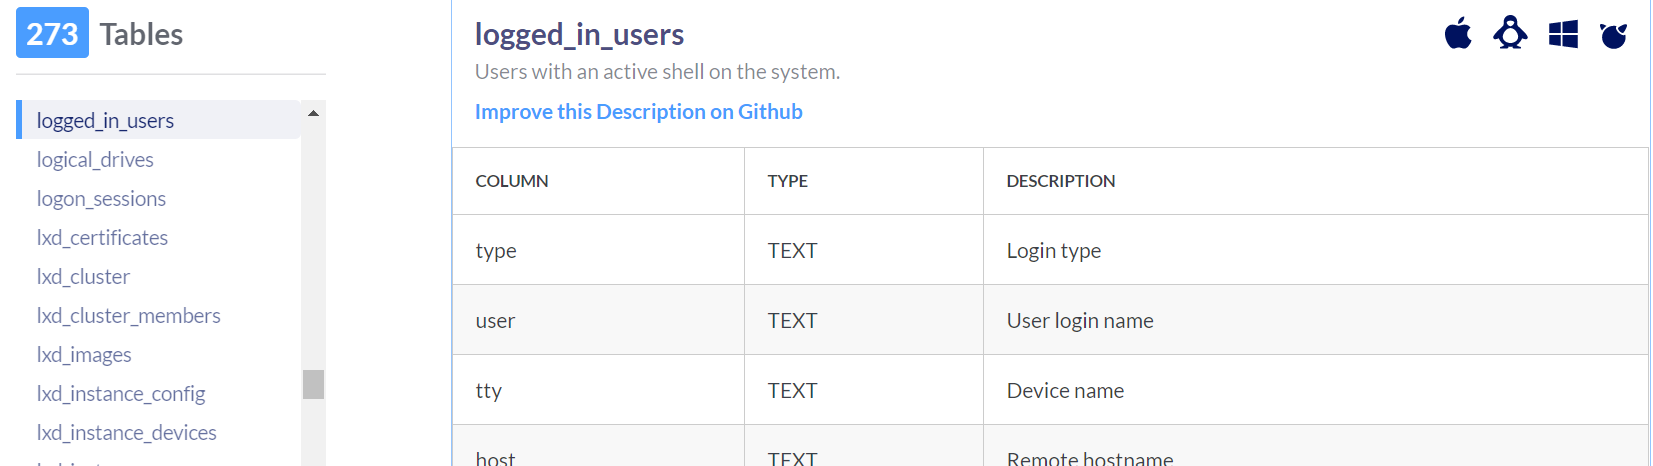
Com a centralização do gerenciamento, podemos ter um monitoramento eficiente para centenas de endpoints, através das consultas realizadas ao Osquery. By having centralized management, we can have efficient monitoring for hundreds of endpoints through the queries made to Osquery. Currently, Osquery has 273 tables (and this changes and increases all the time), which in combination with the queries, can answer countless questions about the environment so that, through FleetDM, you can maintain continuous monitoring through scheduled queries. A breakdown of the Osquery tables can be found on the official Osquery page.
Since monitoring is intrinsically linked to the visibility of the environment, it’s important that we have good questions in mind so that the answers are the most appropriate. We start with, “What’s wrong?” Then, it’s possible to have an adequate answer to “Why?”. Therefore, the monitoring will be based on a possible symptom or specific behavior that we want to monitor to follow possible changes in the state or behavior of the environment.
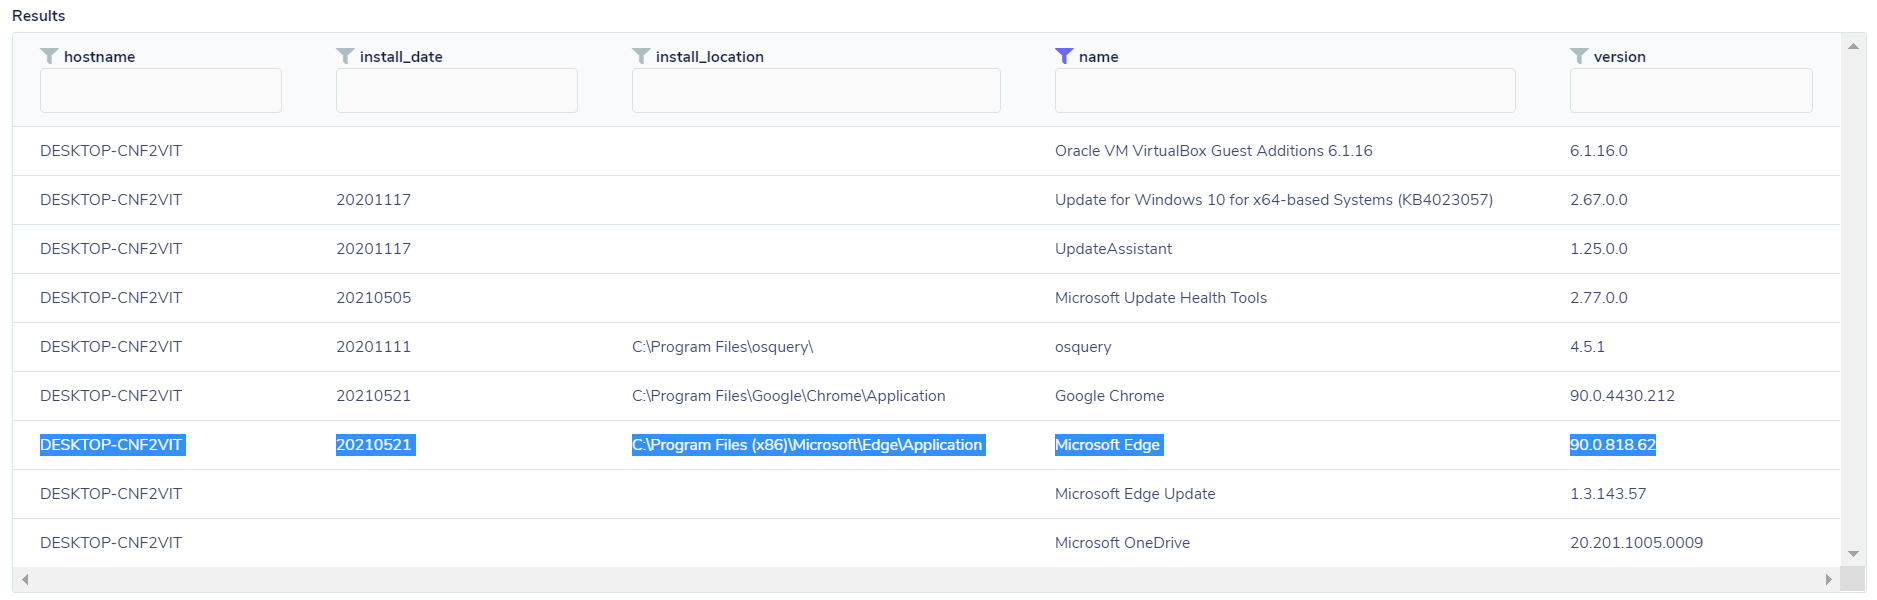
At this point, FleetDM can help us because it works with two different forms of queries: one is what you want to view at the current moment and is called Live query/Distributed query, which is basically a “current” query of the state at that exact instant. Imagine you want to know if there was a new program installed recently on one or more endpoints. To do that, you just need to perform a live distributed query through the “programs” table, which will list all installed programs, so you can check, through the dates, which one was recently installed, as in the example below:
SELECT install_date, install_location,name,version FROM programs
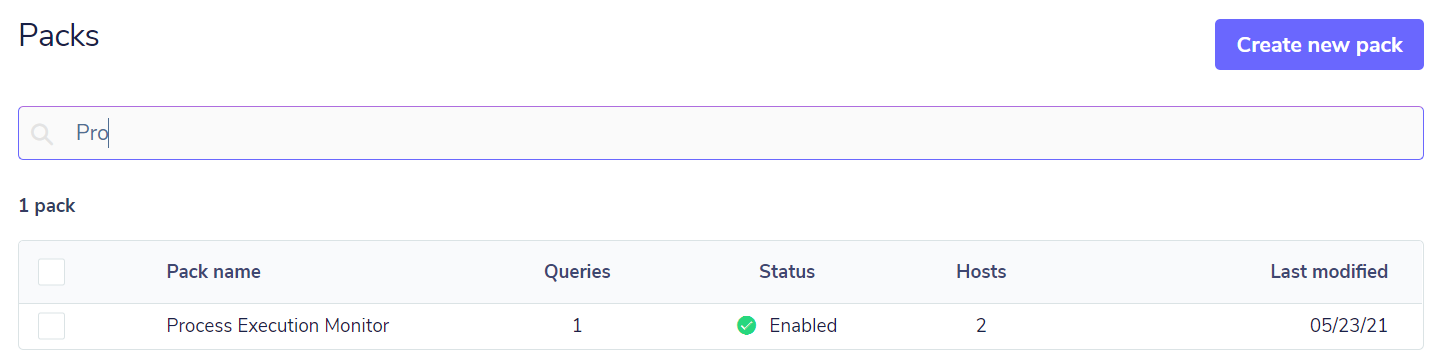
On the other hand, if you want to focus on some kind of more specific problem or behavior, you can perform a scheduled search. If you want to monitor state changes or behavior deviations and especially want to produce logs to be sent to a SIEM, in order to enrich the SOC monitoring, FleetDM has packs that are collections of queries. One detail is that there doesn’t necessarily need to be more than one query to be a pack.
A good example of this would be to monitor the processes and information of an endpoint, along with the hash of their respective executables, to send this information to SIEM based on the process and the hash. Then it would be possible to correlate this data with some feed bank to check if the hash belongs to some known threat.
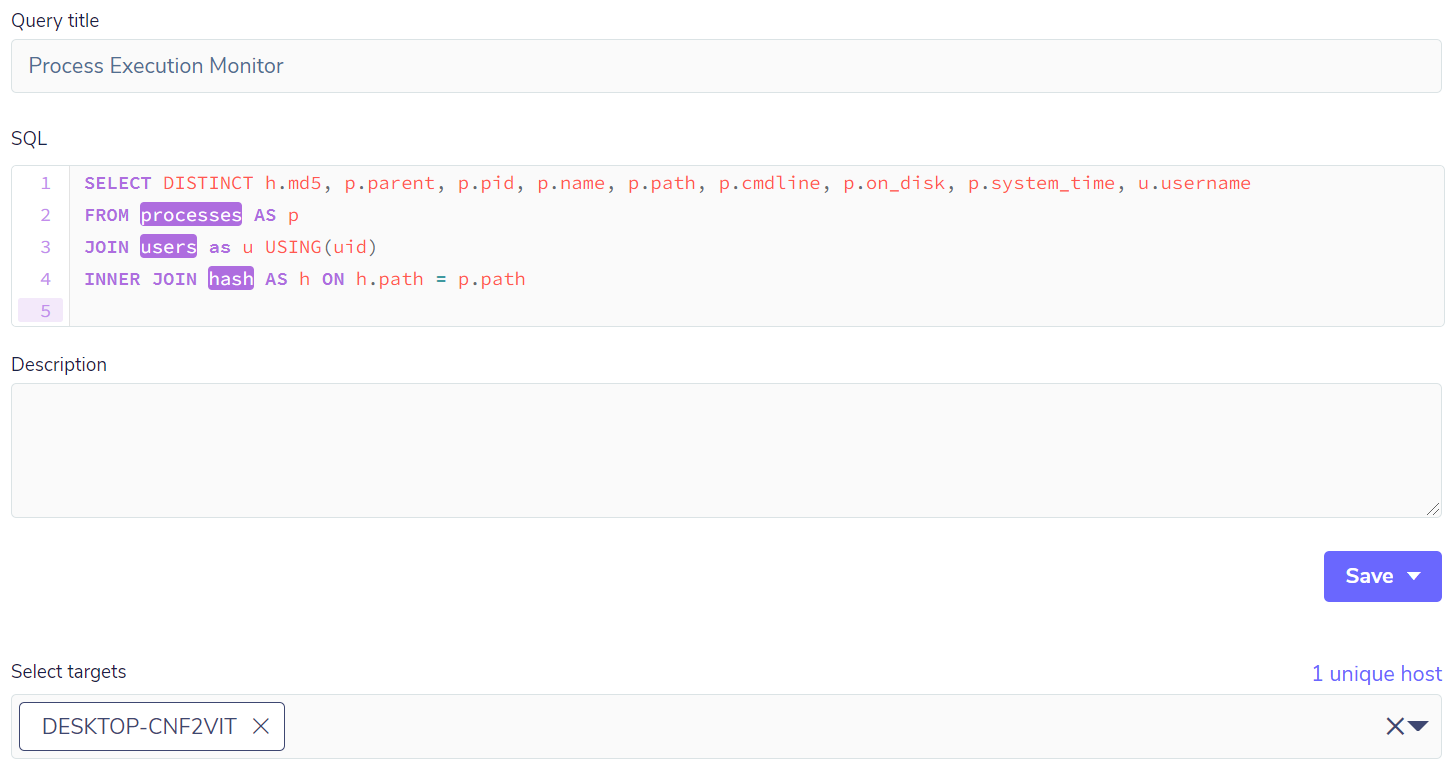
But before having the pack itself, it’s necessary to make a test query to verify that the data is correct and will bring the necessary and sufficient information. In the following example, three tables will be used: process to monitor the running processes, users to monitor the users that are running the respective processes, and finally, the hash table that will bring the hash information in md5. For this query, a JOIN is needed, which will have the function of consolidating the information in a single output:
The result will bring all the processes running at that instant. In order to avoid making the example too large, let’s take just one process to check if all the fields are correct and if the query has inputs for the creation of a pack:
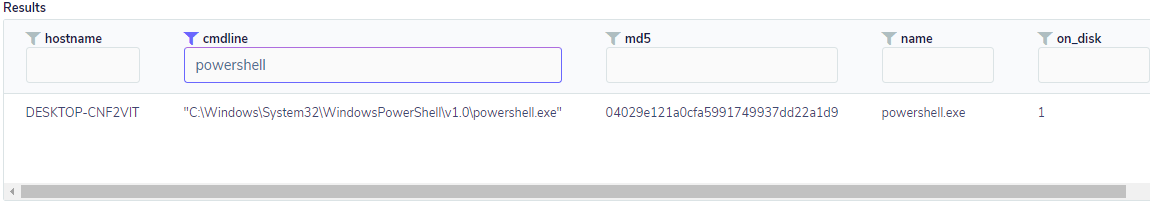
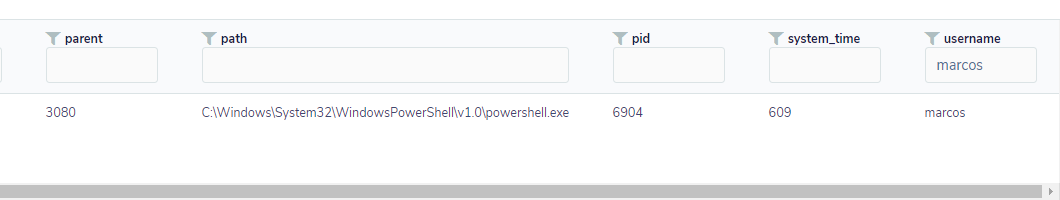
The query brought up relevant process, user, and hash data, among others, and now it’s possible to have a pack to monitor the processes. This pack may, in the future, contain more queries that are relevant so that it can become a collection of process-related queries.
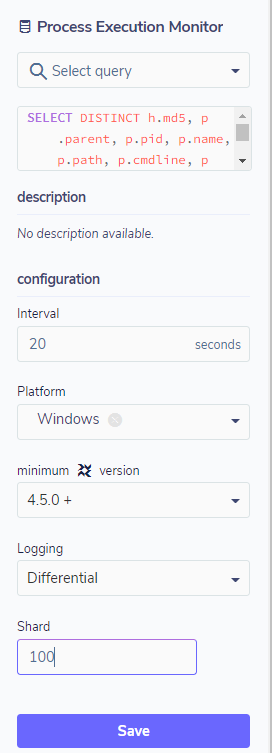
Configuring the pack as a scheduled query is simple and requires a few steps. The most important are: defining the targets, the execution interval, the operating system, and the type of log – which can be differential or snapshot. In snapshot mode, the pack will always bring the information, regardless of whether there has been a state change or not.
In differential mode, the pack will bring only the state changes since the previous query. If there isn’t any change, there will be no logging. In the configuration, you can still define whether you want data from the entire environment or only a sample, defined by percentage through the shard field.
With the pack created and the execution time interval defined, FleetDM will request the Osquery query and save the result to a location defined in the FleetDM installation and configuration in JSON format, which can be exported to a SIEM through syslog or logstash; below is an example of this result:

Another good example of monitoring for supporting teams is monitoring patch updates. These can be useful to check if the endpoints have any vulnerabilities that can be patched but have not yet been applied.
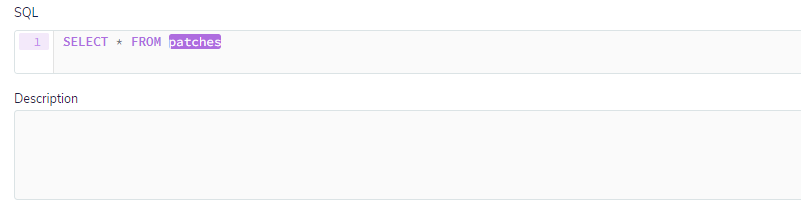
Starting from the simplest point, for this type of monitoring, the table that will be used is patches. With this table, it is possible to check all installations of updates, even security updates. Below a simple query will show all updates for a given host:
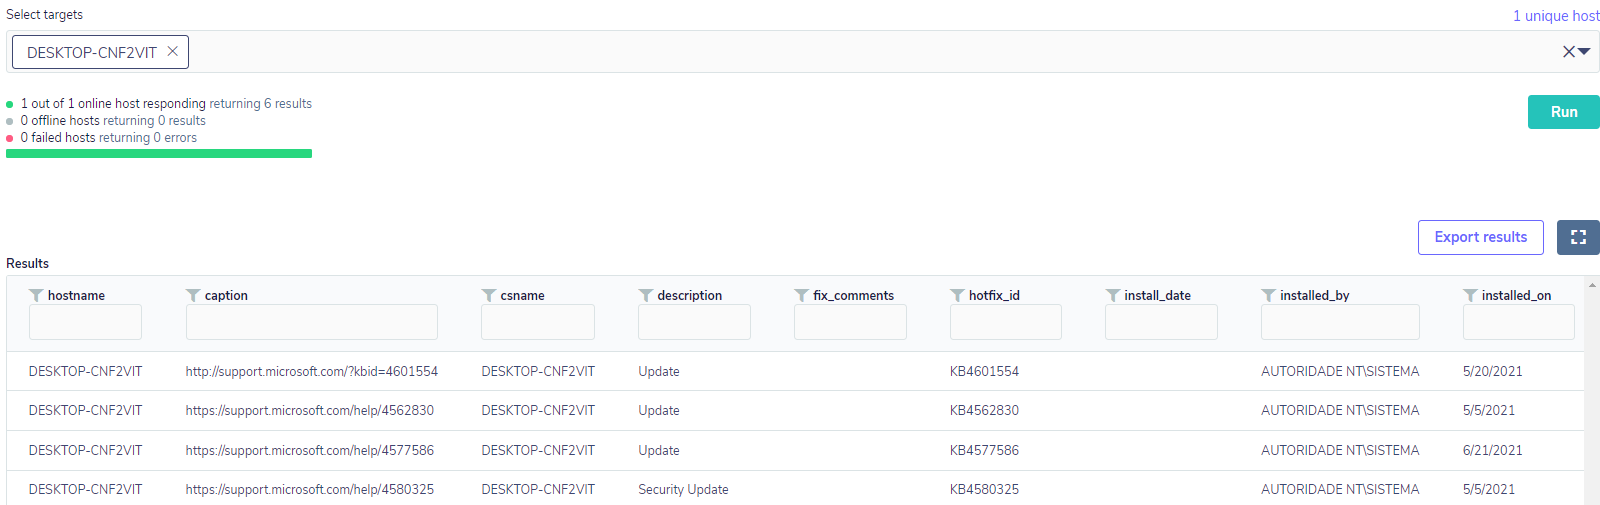
Based on this data, you can assemble a more complex query to look for specific patches pertaining to some critical vulnerability, such as CVE-2020-0601, which allowed a threat agent to sign a malicious executable.
In this case, to assemble a pack to monitor whether or not an endpoint is vulnerable, we would at least need to know which KBs fix the CVE vulnerability. In this case, the KBs that correct the vulnerability are the following:
‘KB4534306’
‘KB4534271’
‘KB4534276’
‘KB4534293’
‘KB4534273’
‘KB4535550’
‘KB4528760’
With this information, the pack will run, at a specific time interval, a query to look for any endpoints that don’t have the patch installed, also finding out if the operating system build is the affected build. Furthermore, in case the patch has already been installed, the query will also check if the endpoint was restarted after the patch was installed so that the patch has been properly applied to the operating system.
Below is the query in its full version – it’s not mine, and there is an article on the official kolide blog with a much more detailed breakdown of its construction:
WITH
split_date AS
(SELECT *,
SPLIT(installed_on, '/', 2) AS year,
SPLIT(installed_on, '/', 0) AS month,
SPLIT(installed_on, '/', 1) AS day
FROM patches),
date_reconstructed AS
(SELECT *,
year
|| '-' ||
SUBSTR(('0' || month), -2)
|| '-' ||
SUBSTR(('0' || day), -2)
|| ' ' ||
'00:00:01' AS install_date_utc
FROM split_date),
restart_check AS
(SELECT *,
CASE
WHEN
(SELECT
datetime(
time.local_time - uptime.total_seconds, 'unixepoch')
FROM time, uptime) > install_date_utc
THEN 'true'
ELSE 'false'
END AS restart_since_install
FROM date_reconstructed),
operating_system AS (
SELECT
CAST(SPLIT (version, '.', 0) AS integer) AS major,
CAST(SPLIT (version, '.', 2) AS integer) AS build,
CAST(SPLIT (version, '.', 3) AS integer) AS patch
FROM kernel_info),
vulnerable_build AS (
SELECT *,
CASE
WHEN major = 10 AND build = 10240 AND patch < 18453 THEN 'true'
WHEN major = 10 AND build = 14393 AND patch < 3443 THEN 'true'
WHEN major = 10 AND build = 16299 AND patch < 1625 THEN 'true'
WHEN major = 10 AND build = 17134 AND patch < 1246 THEN 'true'
WHEN major = 10 AND build = 17763 AND patch < 973 THEN 'true'
WHEN major = 10 AND build = 18362 AND patch < 592 THEN 'true'
WHEN major = 10 AND build = 18363 AND patch < 592 THEN 'true'
ELSE 'false'
END as affected_build
FROM operating_system),
failing_state AS
(SELECT CASE WHEN (SELECT 1
FROM restart_check
WHERE hotfix_id IN (
'KB4534306',
'KB4534271',
'KB4534276',
'KB4534293',
'KB4534273',
'KB4535550',
'KB4528760'))
THEN 'true'
ELSE 'false'
END AS CVE_2020_0601_patch_installed,
CASE WHEN (SELECT 1
FROM restart_check
WHERE hotfix_id IN (
'KB4534306',
'KB4534271',
'KB4534276',
'KB4534293',
'KB4534273',
'KB4535550',
'KB4528760')
AND restart_since_install = 'false')
THEN 'false'
END AS restart_since_install,
CASE WHEN (SELECT 1
FROM vulnerable_build
WHERE affected_build = 'true')
THEN 'true'
END AS affected_build)
SELECT *,
CASE WHEN (restart_since_install = 'false'
OR cve_2020_0601_patch_installed = 'false')
AND affected_build = 'true'
THEN 'true'
END AS vulnerable
FROM failing_state
WHERE vulnerable = 'true'
Upon execution of the query, if there is any endpoint that satisfies the query premises mentioned above, the result will look like the following:
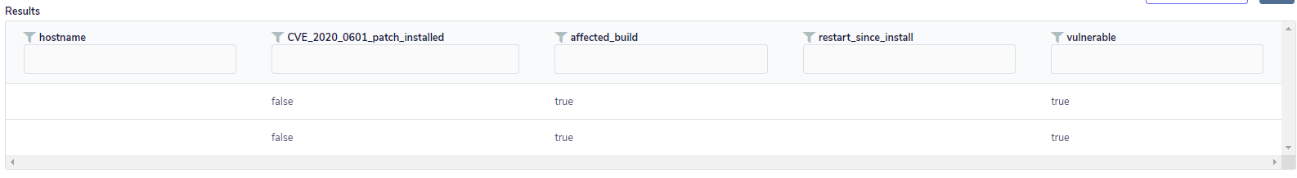
If there is no vulnerable endpoint, no result will be shown. Thus, teams can act more assertively in the correction of a critical vulnerability in their environment, even without a specific vulnerability management tool.
Anomaly Detection
Threats are constantly evolving, and a good part of the attackers usually make their attacks, especially against endpoints, due to the possibility of being the “most vulnerable” means in an organization. Considering that they are maintained by common users, who almost always do not recognize when something is wrong, or there is some behavioral anomaly in progress, the allied use of FleetDM with Osquery makes it possible to detect some anomalies in an interesting way. To do this, you just need to create queries and packs that can proactively detect anomalies that you want to take immediate action. Although we have done some query and pack processes before, let’s illustrate something closer to how anomaly detection engineering works in the upcoming sections. You will see that the biggest effort is not in writing the queries themselves but rather in knowing what query should be done and what should be returned as a result in order to provide accurate detection of malicious behavior. It is worth noting that even though FleetDM and Osquery are powerful and work similarly to an Endpoint Detection and Response (EDR), the response process is not automated as it usually is in an EDR.
Preventing user password changes
Here we are going to simulate a hypothetical case of an anomaly of a successful attack, where the attacker seeks to maintain persistence in the affected environment. To do this, it’s common to create Golden Tickets and Silver Tickets. Kerberos uses authentication tokens or tickets to validate AD identities, and this includes users who have a password in Active Directory.
When the attacker has access to the endpoint, he will attempt to extract the hash of the service account so that through a tool such as “Kerbeoast,” he can crack the password and subsequently generate a fake Silver Ticket. This can allow services to log in without double-checking whether the token is valid or not and can even allow the attacker to escalate privileges.
Fake Silver Tickets are very difficult to detect because the records are local, and there is no communication between the service and the domain controller. Based on this, the intent of anomaly detection would not be to detect the Silver Ticket itself but rather a behavior that indicates its use.
After all this process, the attacker knows that if there is an account password change, the Silver Ticket will become invalid. And this is when we may monitor an anomaly: usually, administrators implement policies for recurrent password changes on endpoints. However, attackers, knowing this and already possessing an elevation of privilege, can, through the Windows registry, prevent the password change.
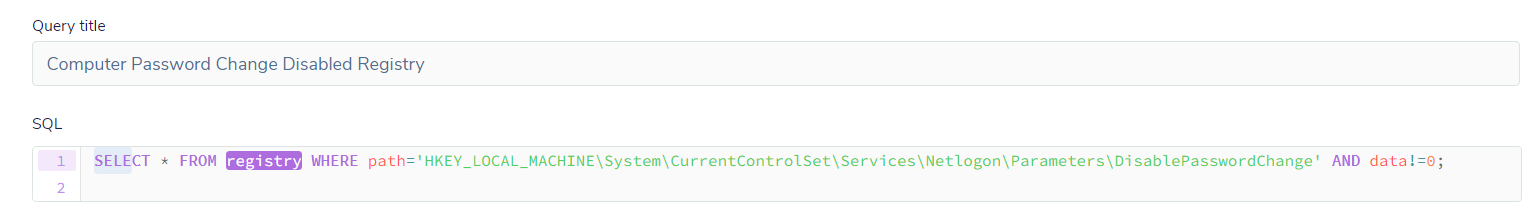
The key that controls this is:
HKEY_LOCAL_MACHINE\System\CurrentControlSet\Services\Netlogon\Parameters\DisablePasswordChange
The attacker changes its value to 1, preventing the password change from occurring. Thus he gains persistence since his Silver Ticket will still be valid. In other words, the change of the key’s value is the anomaly point we were looking for, even without necessarily knowing if there was a Silver Ticket; if there is a strong indication like this, one should consider this initial anomaly point to conduct a more refined investigation.
Let’s see how the monitoring of this anomaly would look like in practice. First, we need to create a pack with a simple query that will monitor the state change of the key as follows:
If the value of the key is changed from the default, whose value is 0, the query will return a result like this:
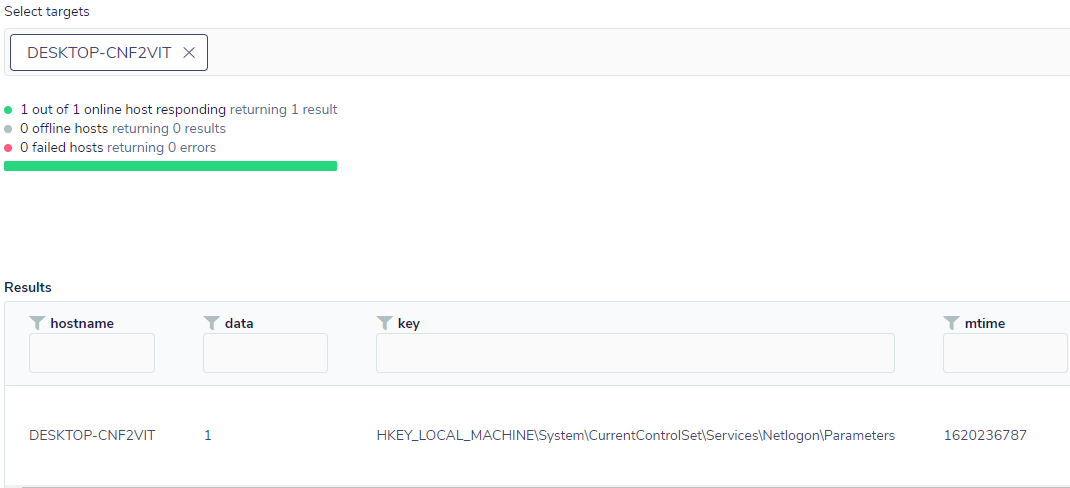
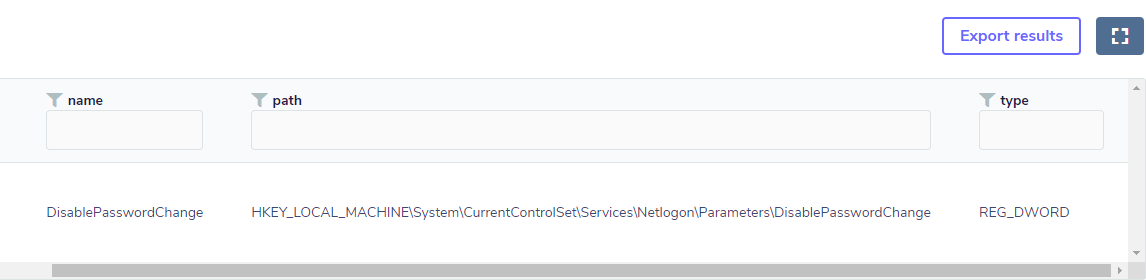
Changing the default value of the key goes against an environment where a password change policy is in place and is, therefore, an indication that something is possibly not normal. However, this alone does not indicate with certainty whether a fake Silver Ticket was created or used, so it is an anomaly that needs further evidence to be verified. However, in this case, FleetDM combined with Osquery can provide visibility to a SIEM in a simple way; in addition, other queries related to this issue can be added to the pack to increase the level of detection with greater assertiveness.
Local administrative account
As mentioned before, here we have another case to illustrate a form of persistence, something that is very dangerous in a post-exploitation scenario, where attackers usually create local accounts, usually with administrative privilege, so that they can perform other malicious actions in the already compromised environment.
Windows has unique identifier sets for entities or groups, and these unique values can identify which group a user belongs to. In this case, the Windows SID has a relative identifier, which is the last three numerals of the SID. According to Microsoft’s official documentation on relative identifiers with the value 544, this number represents that the user has administrative privileges.
Based on this, we can create a pack to detect a local account creation anomaly with administrative privileges. However, we also know that in a corporative environment, there can be occasional additions of users with administrative privileges, so it’s important that they are validated through a list in the SIEM.
The pack query might initially look like this:
select s.hostname,users.uid,users.gid,users.username,users.directory, user_groups.gid from users JOIN user_groups ON users.uid=user_groups.uid,system_info s where user_groups.gid=544
In testing, we had only the local user administrator as per the query below:
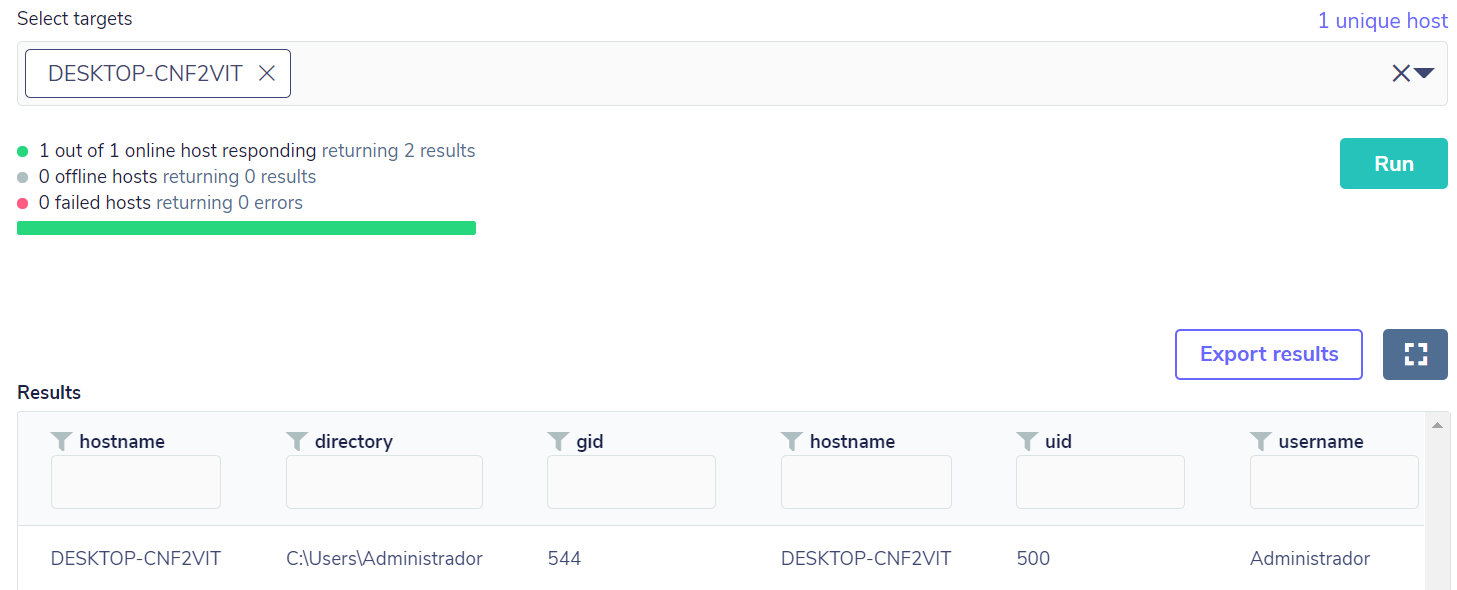
Then an addition of a local account with administrative privileges was performed, so the query returned the result as expected, based on the “gid” field with value 544:
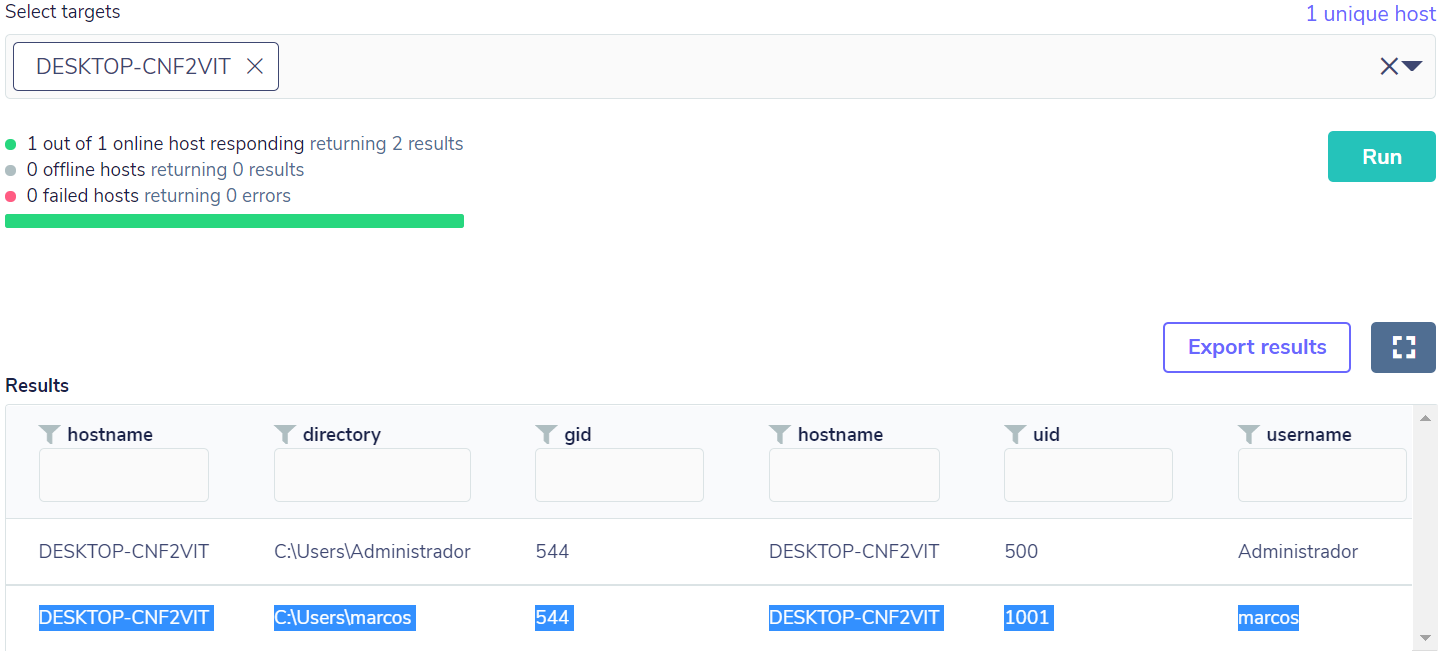
After this anomaly detection, it’s possible to make a correlation with other activities in order to determine a potentially malicious activity.
Persistence, execution key (RunOnceEX)
Another type of anomaly related to persistence is the creation of registry keys in the operating system, keys that can be used to execute an arbitrary payload or a malicious dll.
In the middle of 2018, Oddvar Moe discovered a location in the Windows registry that could allow the execution of a dll when logging on. It’s all documented in detail on his blog, “ODDVAR MOE’S BLOG“. However, this kind of action requires administrative privileges, which the attacker could probably achieve in other ways, as demonstrated in the previous topics.
The key Oddvar discovered would be this:
HKLM\SOFTWARE\Microsoft\Windows\CurrentVersion\RunOnceEx\0001\Depend /v 1 /d "C:\temp\messageBox64[.]dll"
Once the attacker was in possession of the compromised endpoint, he could add the key to the registry as per the example below:

Given that this is an even more serious type of anomaly than the ones demonstrated above and therefore requires more attention, we can put together a pack with a query that will check for the existence and state of this key, along with its value. Thus, the date field will possibly reference some executable or DLL.
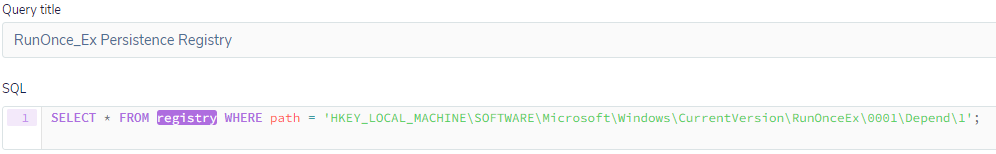
If the key exists and it has some value assigned to it, there will be a similar result to the one shown below:
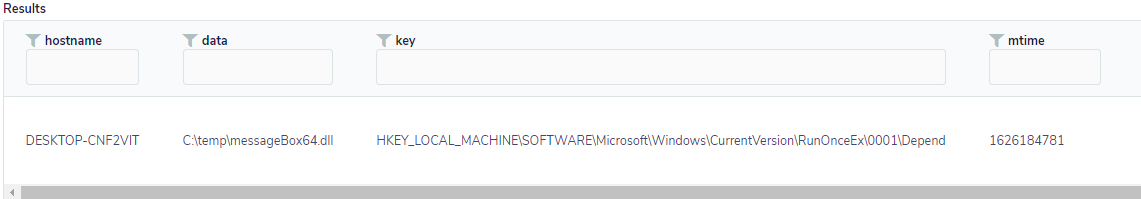
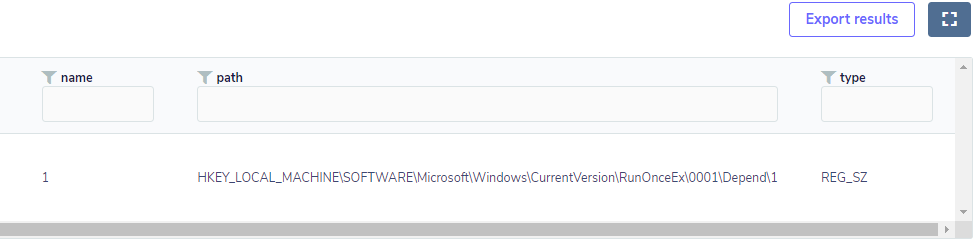
This will serve as a kickoff for an in-depth investigation on the endpoint, as it shows that there has possibly been an exploitation.
Final Considerations
As we have seen, visibility and monitoring are two important points that are targeted by many organizations. Therefore, with a simple and Open Source tool, it’s possible to get ahead of the attackers: since you can only monitor and detect what you see.
Furthermore, a tool that gives such freedom of research is of great interest. However, it is important to understand the threats and certain problems that you want to observe because only in this way can you make good queries to obtain useful results so that you can correlate those findings with other sources in your SIEM and thus be more proactive in mitigations.
The idea here was to present and demonstrate ways to better use FleedDM associated with Osquery and demonstrate that the use of these tools can be applied as a starting point to gain visibility and monitoring.
To learn more about the FleetDM project, check out its official page on github, where versions and implementation documentation are kept.
References
[1] Stuifbergen, Joshua. IBM. Monitorando ambientes conteinerizados com osquery. Available at: https://developer.ibm.com/br/technologies/systems/articles/monitoring-containers-osquery/. Accessed on: 04/Oct/2021.
[2] Facebook Engineering. Introducing osquery. Available at: https://engineering.fb.com/2014/10/29/security/introducing-osquery/. Accessed on: 05/Oct/2021.
[3] Metcalf, Sean. Active Directory Security. Available at: https://adsecurity.org/?p=2011. Accessed on: 06/Oct/2021.
[4] Microsoft. Security identifiers. https://docs.microsoft.com/en-us/windows/security/identity-protection/access-control/security-identifiers. Accessed on: 05/Oct/2021
[5] Mitre Att&ck. Create Account: Local Account. Available at: https://attack.mitre.org/techniques/T1136/001/. Accessed on: 11/Oct/2021.
[6] Oddvar Moe’s Blog. Persistence using RunOnceEx – Hidden from Autoruns.exe. Disponível em: Persistence using RunOnceEx – Hidden from Autoruns.exe Accessed on: 08/Oct/2021.
[7] Kolide. Using Kolide + osquery to find and fix critical Windows Crypto Vulnerability. Available at: https://blog.kolide.com/using-kolide-osquery-to-find-and-fix-critical-windows-crypto-vulnerability-b6c05e33a9cf. Accessed on: 11/Oct/2021.
[8] Osquery. Schema. Available at: https://www.osquery.io/schema. https://blog.kolide.com/using-kolide-osquery-to-find-and-fix-critical-windows-crypto-vulnerability-b6c05e33a9cf Accessed on: 12/Oct/2021.
[9] Mitre Att&ck. Boot or Logon Autostart Execution: Registry Run Keys / Startup Folder. Available at: https://attack.mitre.org/techniques/T1547/001/. Accessed on: 13/Oct/2021.