Access to allocated and unwritten memory area is a common programming error. Anyone who codes for Windows may forget to properly initialize a variable, and thus create unexpected behavior in the application. This is a frequent mistake, and therefore the operating system is prepared to warn you. After all, access to allocated and unwritten memory areas can become a security problem. Therefore, they need to be investigated and corrected.
But what if, more than that, the programmer uses the programming mistake to implement an anti-debugging mechanism? After all, new anti-debugging techniques are always welcome, as we’ll see later; making the detection and prevention of unwanted debugging always important.
First of all, the program must recognize that it is in a debugging process. A simple way for the program to detect that it is running in a debugger is through the byte patterns in the heap after memory allocations. When investigating an access to allocated and unwritten memory error bug, through the eyes of a debugger, we find the following scenario:
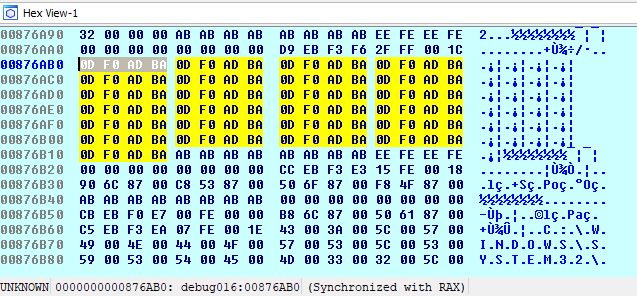
The memory position related to the uninitialized variable is filled with the hexadecimal value “0xbaadf00d”, where we have 0D F0 AD BA, in little endian, or better BA AD F0 0D, being repeated several times.
In C/C++, when we dynamically allocate a variable, and forget to initialize it with a value, the variable may have what we call ‘garbage’, that is, residual information in memory that is no longer useful for future computations. However, the pattern found (“0xbaadf00d”) does not appear to be garbage, as it repeats itself in every execution during debugging. It also indicates to have some meaning, which can be perceived by the easy reading of the English expression “bad food” in l33tspeak.
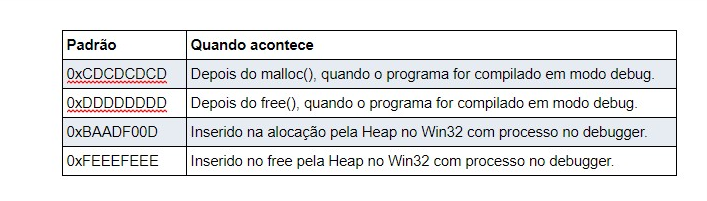
Hewardt and Pravat [1] state that the value “0xbaadf00d” is used by the Windows HeapAlloc() function during debugging to help detect bugs. Already in nobugs.org [2], we discovered the existence of other byte patterns placed in memory in special situations to help in bug discovery:
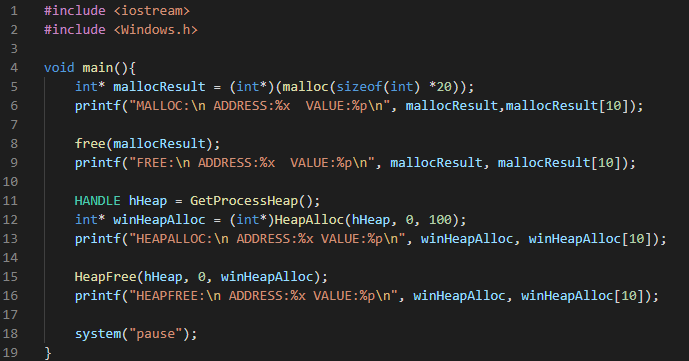
To reproduce the above values, we have prepared a program that tries to replicate the heap allocation scenarios:
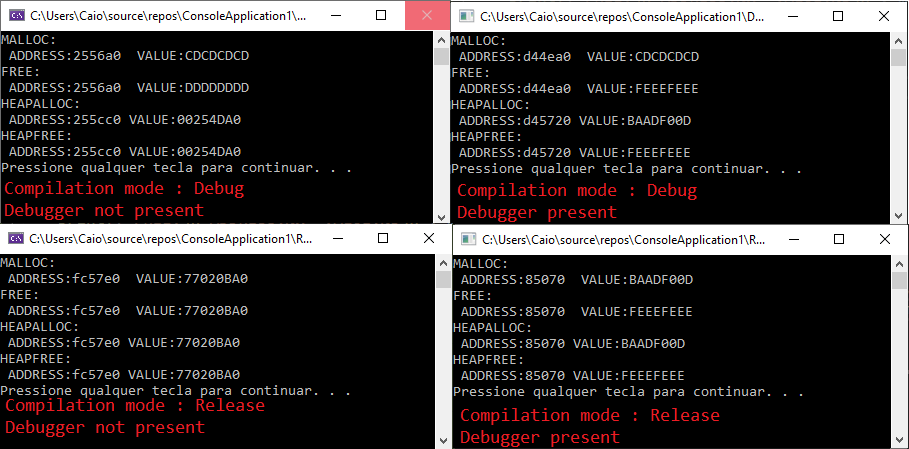
The following image illustrates the four possible results depending on the compilation settings:
Anti-debugging techniques like this are important so that developers can make it difficult reverse engineer their software in order to protect their intellectual property. However, we cannot fail to recognize that such techniques can also be used in shady and illegal scenarios; when, for example, malicious actors plan to make it difficult to reverse their malware.
These techniques consist of exploiting debugger behaviors in order to detect their actions; and finally, preventing their loading or execution on critical sections. To demonstrate that it is possible to use this heap property as an anti-debugging mechanism, we present below a code snippet that causes the behavior described above:
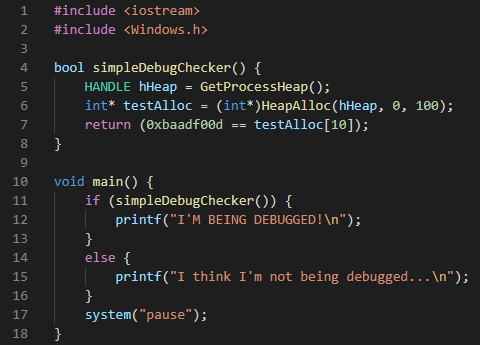
Finally, we stress the importance of knowing the effects that a debugger can cause in its application, even if passively. Therefore, in order to implement a strong anti-debugging solution, several techniques must be used in order to create a considerable layer of difficulty against the reverse engineering process. The technique presented here is only another one that can be used for such purpose.
References
[1] Advanced Windows Debugging de Mario Hewardt e Daniel Pravat [https://www.oreilly.com/library/view/advanced-windows-debugging/9780321374462/]
[2] http://www.nobugs.org/developer/win32/debug_crt_heap.html